
The Tychean Codex: Power Laws
There is no logical reason the sun must rise tomorrow, even though it has risen every day of your life. Saying it will not rise is not inherently contradictory or absurd.

"There is no logical reason the sun must rise tomorrow, even though it has risen every day of your life. Saying it will not rise is not inherently contradictory or absurd."
— David Hume, An Enquiry Concerning Human Understanding (1748, paraphrased)
Note: This is part two of The Tychean Codex, a five-part series drawing from Taleb's Incerto. It aims to synthesize core concepts from the series and build the intellectual foundation for a tail-risk investment strategy.
- The previous piece, part one, can be found here.
- The next piece, part three, can be found here.
- The code for generating the plots can be found here.
Table of Contents
- Life In Extremistan
- Power Laws and Fat Tails
- The System Dynamics of Extreme Behavior
- Epistemic Errors
- Positioning, Not Prediction
- Learn More
Life In Extremistan
In the last post we explored two worlds: Mediocrestan and Extremistan. Mediocrestan is the world of the normal distribution. It is measurable, understandable, predictable. Extremistan is something else entirely. It appears stable, even boring, until a single massive event arrives and changes everything.
The danger isn't so much that large events happen; it's that we don't see them coming. We assume we're in Mediocrestan when we're living in Extremistan. This was illustrated in the Turkey Problem. A turkey, fed and sheltered by its owner every day for a year, builds an unshakeable conviction that tomorrow will look like today. Thanksgiving comes, and the turkey is killed. We also looked at a real-world example of the same mistake. Long-Term Capital Management, a hedge fund, used sophisticated tools, mountains of data, Nobel laureates, and models of extraordinary complexity. None of these helped them predict a market crash that left them insolvent.
Unfortunately, normal distributions (the mathematical representation of Mediocrestan) are woven into daily life in ways most people never notice. They show up in shoe sizes, in the normal ranges your doctor reads off your bloodwork, in the timing of traffic lights, and the premium on your car insurance. The normal distribution is a hidden assumption embedded in most of the systems humanity has built to manage risk and make decisions at scale.
If we're going to avoid being the turkey, we need to understand what makes Extremistan so extreme. What creates a world so prone to catastrophic risk?
Power Laws and Fat Tails
If the normal distribution describes Mediocrestan, then power laws describe Extremistan. Power laws describe a relationship between two quantities, where one quantity varies as a power of another quantity. For instance, the volume of a cube has a power-law relationship with the length of the side. If the side of a cube is doubled, the volume of the cube will be multiplied by 2^3 (or 8). If you triple the side of the cube, its volume will be multiplied by 3^3 (or 27). In every case, the relationship is described by a power, or exponent, of 3.
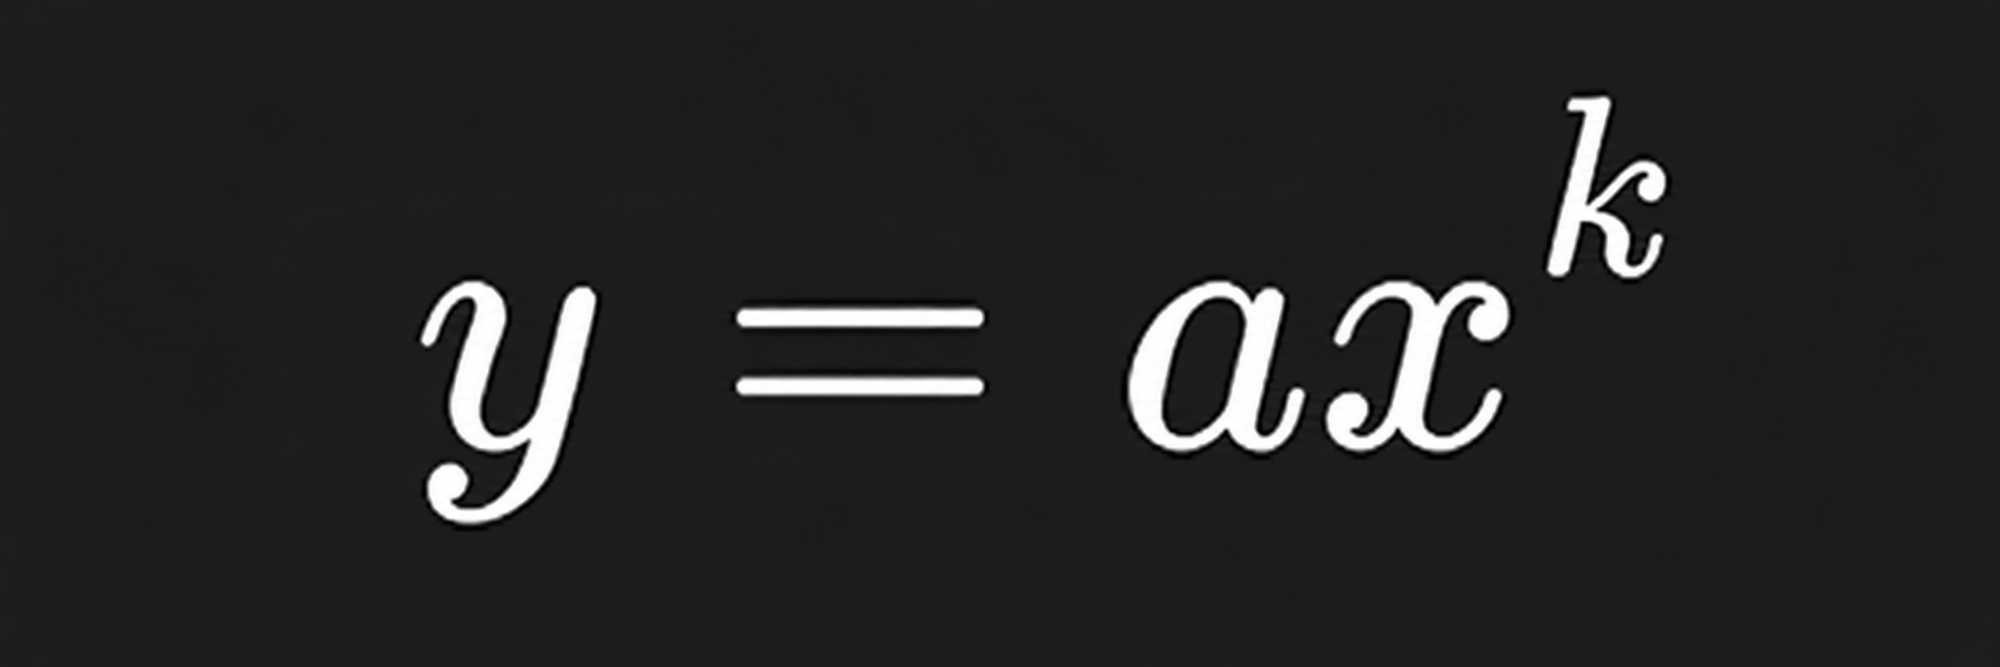
The equation for a power law. Like the normal distribution, it has only two parameters: a constant (a) and the exponent (k).
Let's revisit probability distributions from Part 1 of this series. They are models that show the likelihood, or our belief, in a future outcome. The height of the distribution tells us how likely an outcome is: taller means more likely, shorter means less likely. The x-axis shows us the possible outcomes, like height, test score, annual rainfall, and so on.
We can see a normal distribution below, on the left. Outcomes near the average, three, are the most likely. The curve peaks around this value, but as you move away from it in either direction, outcomes thin out quickly, and the curve slopes back toward zero. This is the familiar bell curve of Mediocrestan. Most outcomes huddle around a typical value, and the extremes thin out fast.
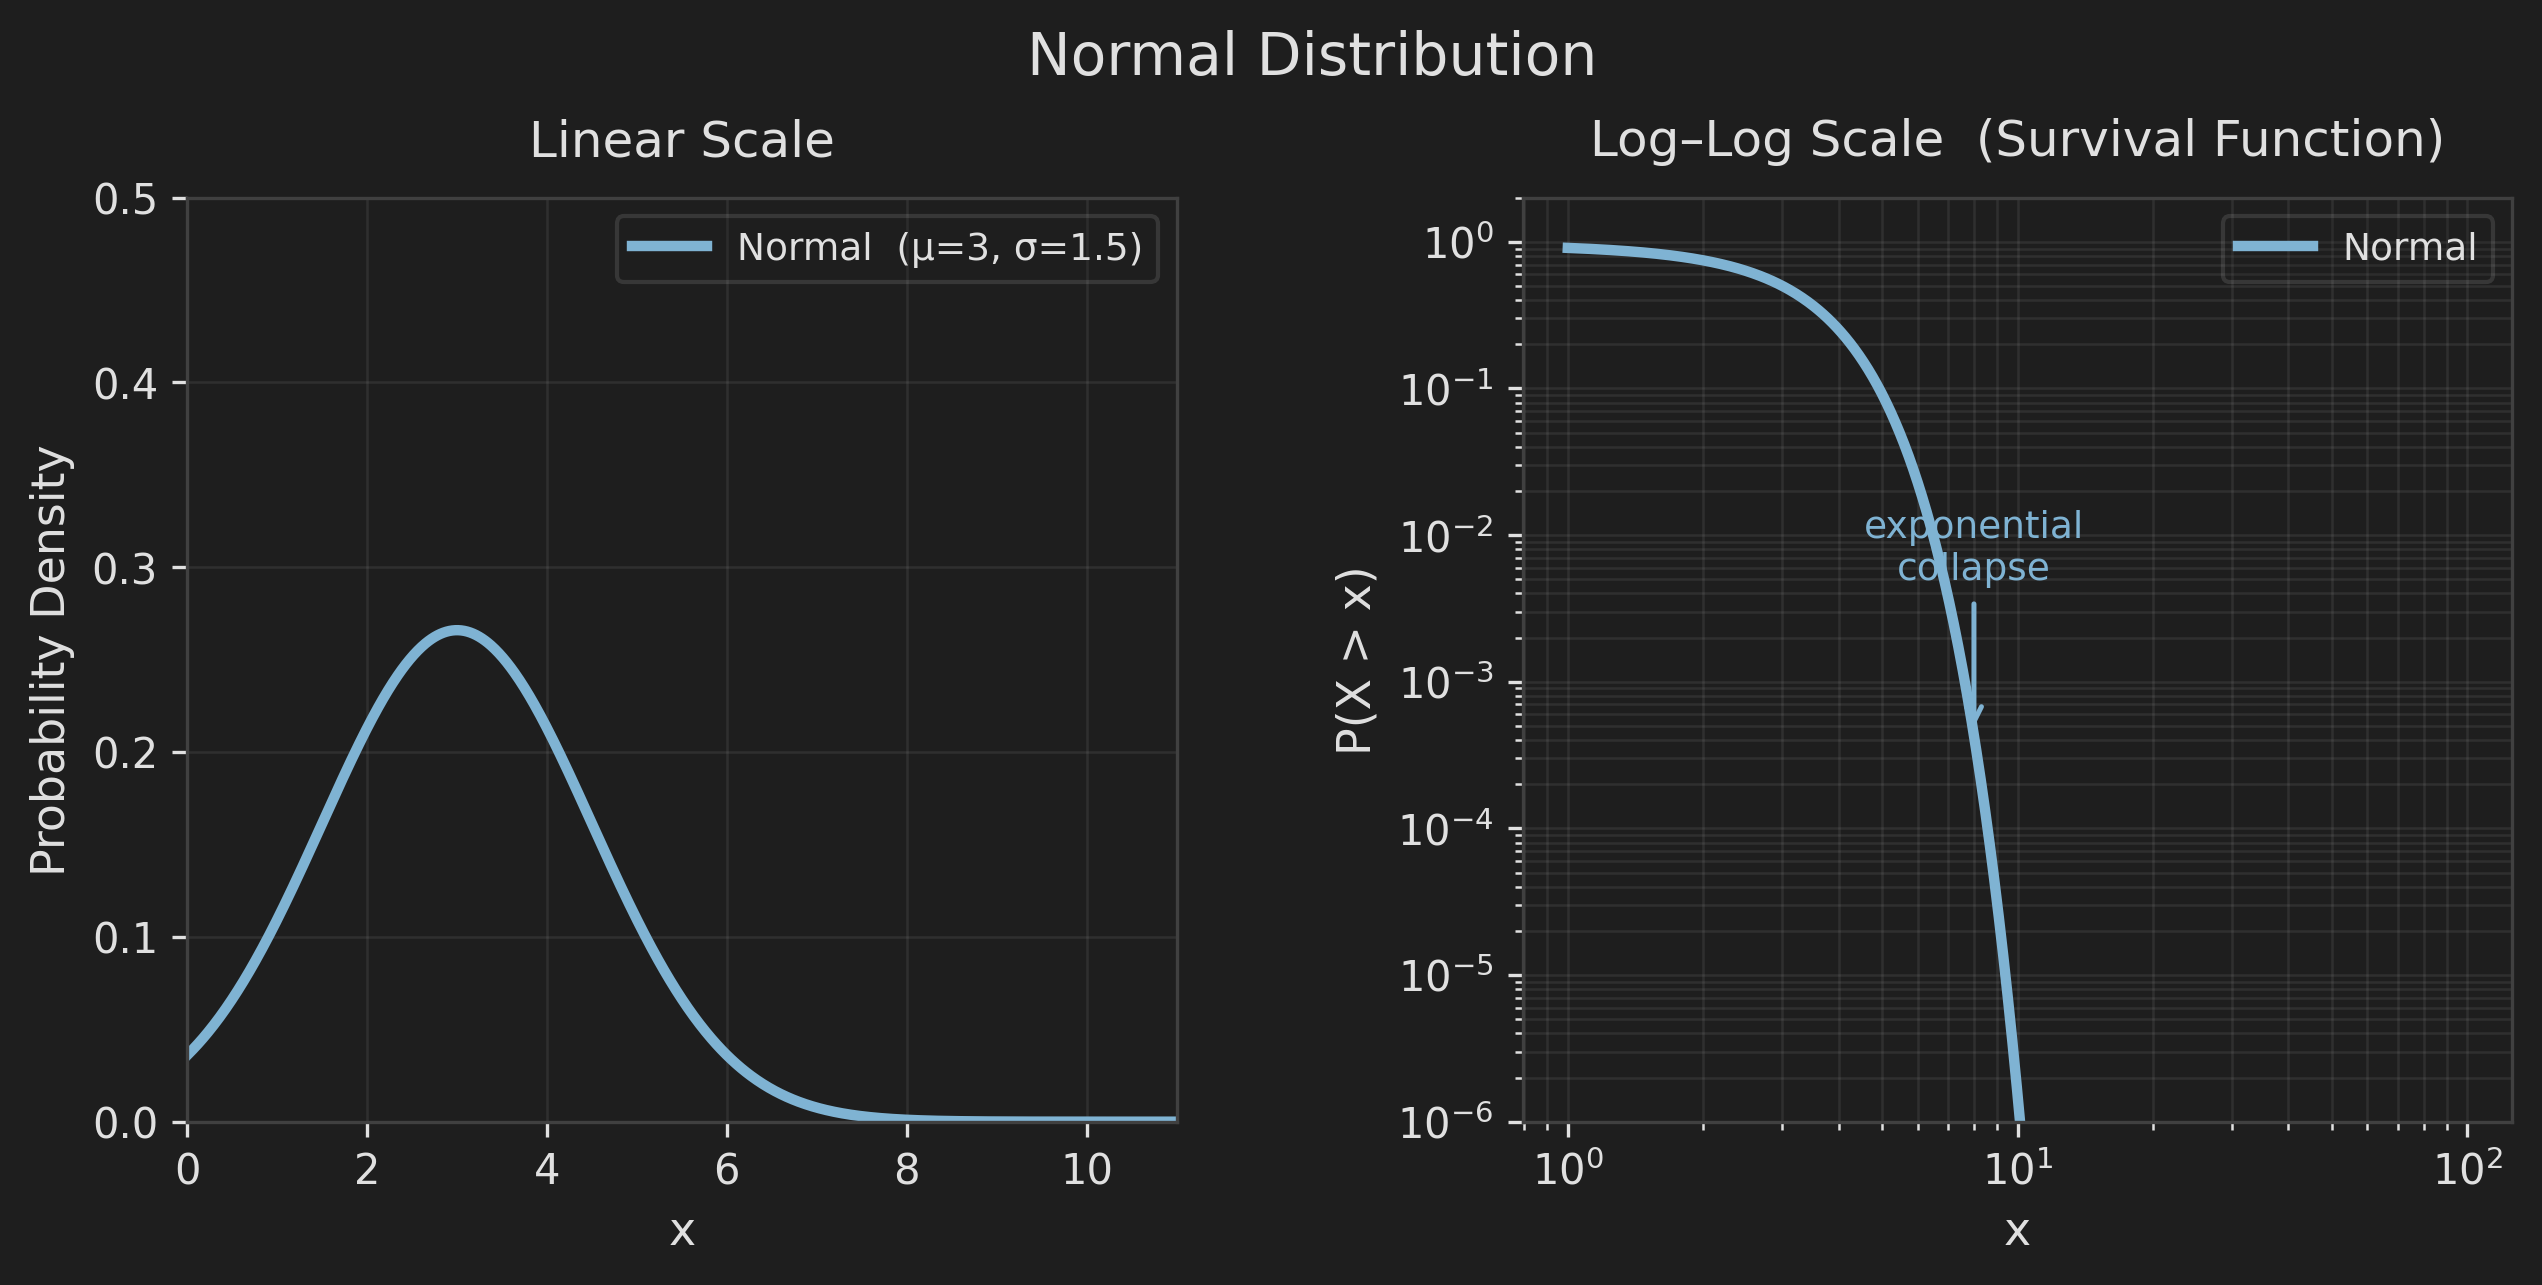
The same normal distribution shown two ways: as a bell curve on linear axes (left) and as a survival plot on log-log axes (right).
Now look at the plot on the right. Before we read it, we need to understand its axes, because they don't work like a normal chart.
This is a log-log plot, because both axes use a logarithmic scale. Instead of a linear scale (1, 2, 3, 4, etc.), a logarithmic scale (1, 10, 100, 1000, etc.) shows us ratios. Imagine plotting the height of an ant and a skyscraper on the same graph. If you scaled it to see the whole skyscraper, the ant would be invisible. If you scaled it to see the ant, the skyscraper would shoot off the page. A log scale fixes this problem, allowing us to show both ordinary events (the ant) and extreme events (the skyscraper) on the same graph, because each step multiplies rather than adds.
With those axes in mind, we can read the curve. This is a survival plot, and it tells us, "What is the probability of getting a value larger than this one?"
Say I have a sample of one hundred thousand people and I pick a height of 3 feet. There's a very big chance the next person I sample will be taller, so the curve is high on the left (taller means a larger probability). As I move up the x-axis, the probability drops off. Choose a height of 5 feet, then 6, then 7, and it becomes harder and harder to find someone in my sample that is taller. By the time you arrive at the far right, the curve has plunged to almost nothing because virtually no one exceeds those large heights.
This plunge is a key trait of normal distributions and Mediocrestan. The normal distribution's survival curve doesn't just decline, it drops precipitously. This is the visual representation of a world where extreme events effectively cannot happen.
This is the shape of Mediocrestan. So what does Extremistan look like on the very same plots?
Below is a power law, represented by a Pareto distribution, plotted exactly as we plotted the normal. Start on the left, and notice what's gone. There's no bell shape. No hump, no symmetry, no average for outcomes to gather around. The curve starts high and falls away, steeply at first, then gently. The most likely outcome is the smallest one, and every larger value is rarer than the one before it.
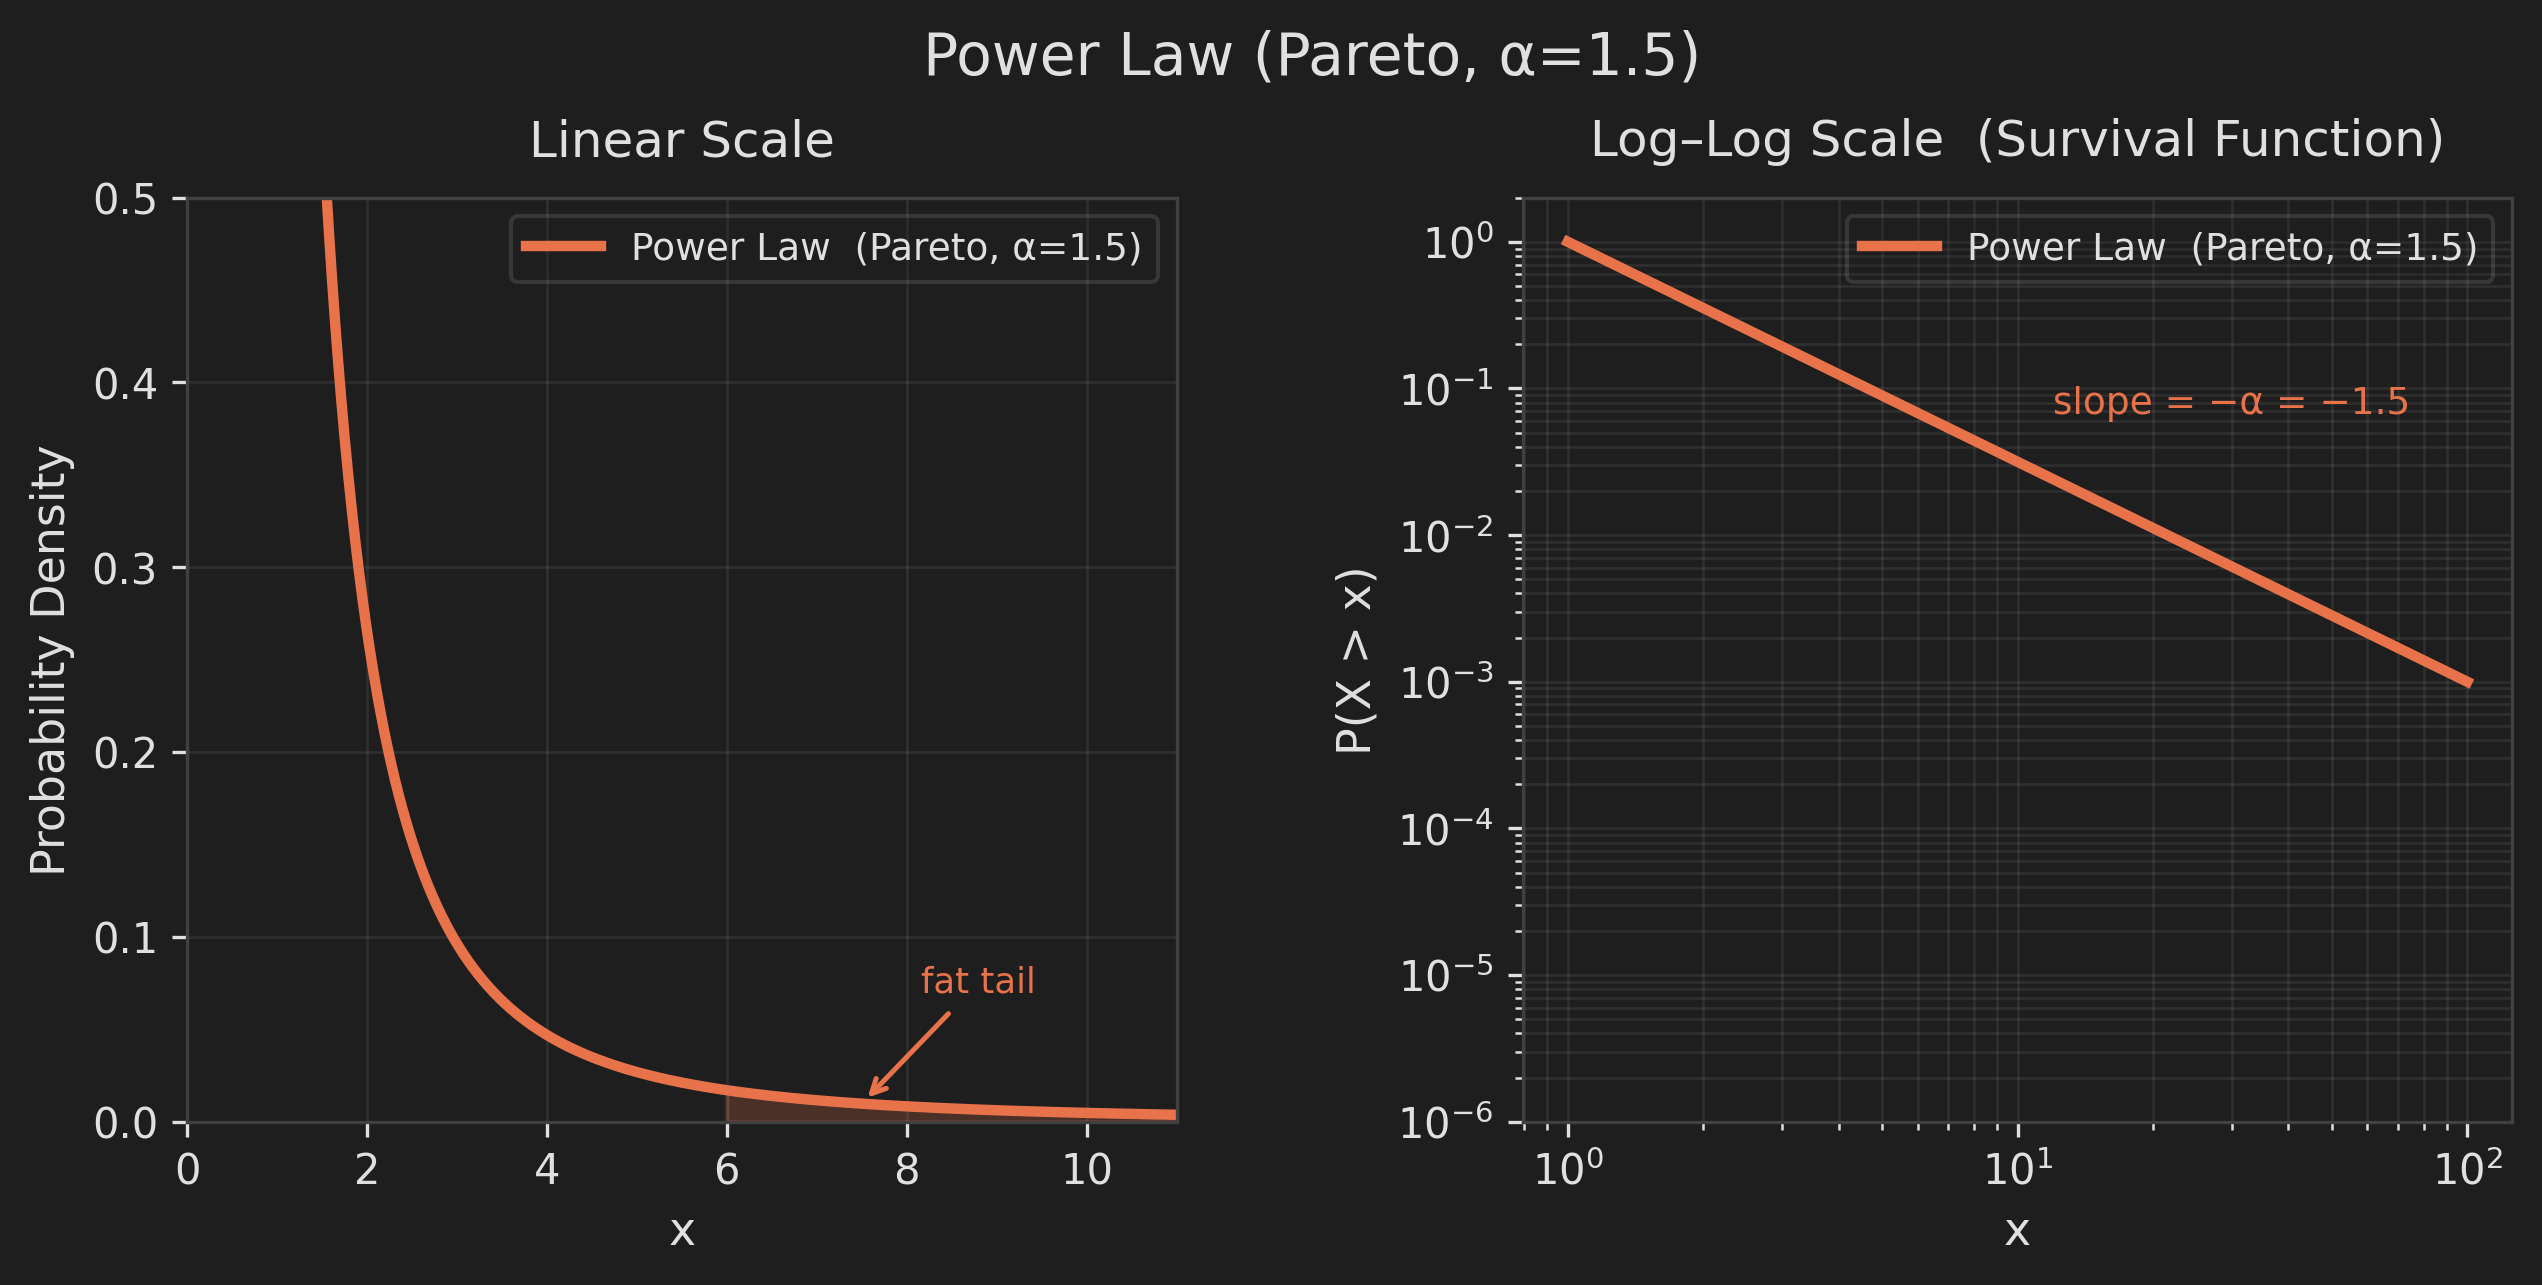
The same power law shown two ways. On the linear scale (left) the fat tail nearly vanishes; on the log-log axes (right) it reveals itself as a perfectly straight line.
Here's the problem. Follow that left-hand curve outward and it flattens, hugging the axis, looking for all the world like it's dying off, exactly the way the normal's tail did. On this scale the power law looks tame. The "fat tail" annotation on the graph highlights the problem. Statisticians call this a "fat tail," where the distribution falls off, but the probability doesn't go to zero as quickly as a normal distribution. It's so faint you could easily miss it. The most dangerous part of this distribution is this part, and an ordinary chart doesn't do a great job of showing you.
We can switch to the log-log axes that exposed the cliff from our normal distribution to determine where the extreme events eventually start to fall off.
It never comes.
Instead of falling away rapidly, the extreme events decrease slightly in chance in a linear fashion. On the normal's plot, each step outward decreased the probability by a huge factor until they effectively stopped. Here, every step gives you a moderate decrease. Going from 1 to 10 thins the odds by the same factor as going from 10 to 100, or 100 to 1000. The line never drops off or quits. There is no ceiling on large events, and there is no largest value the distribution will promise you've already seen.
If we layer the two on top of each other, the difference becomes evident.
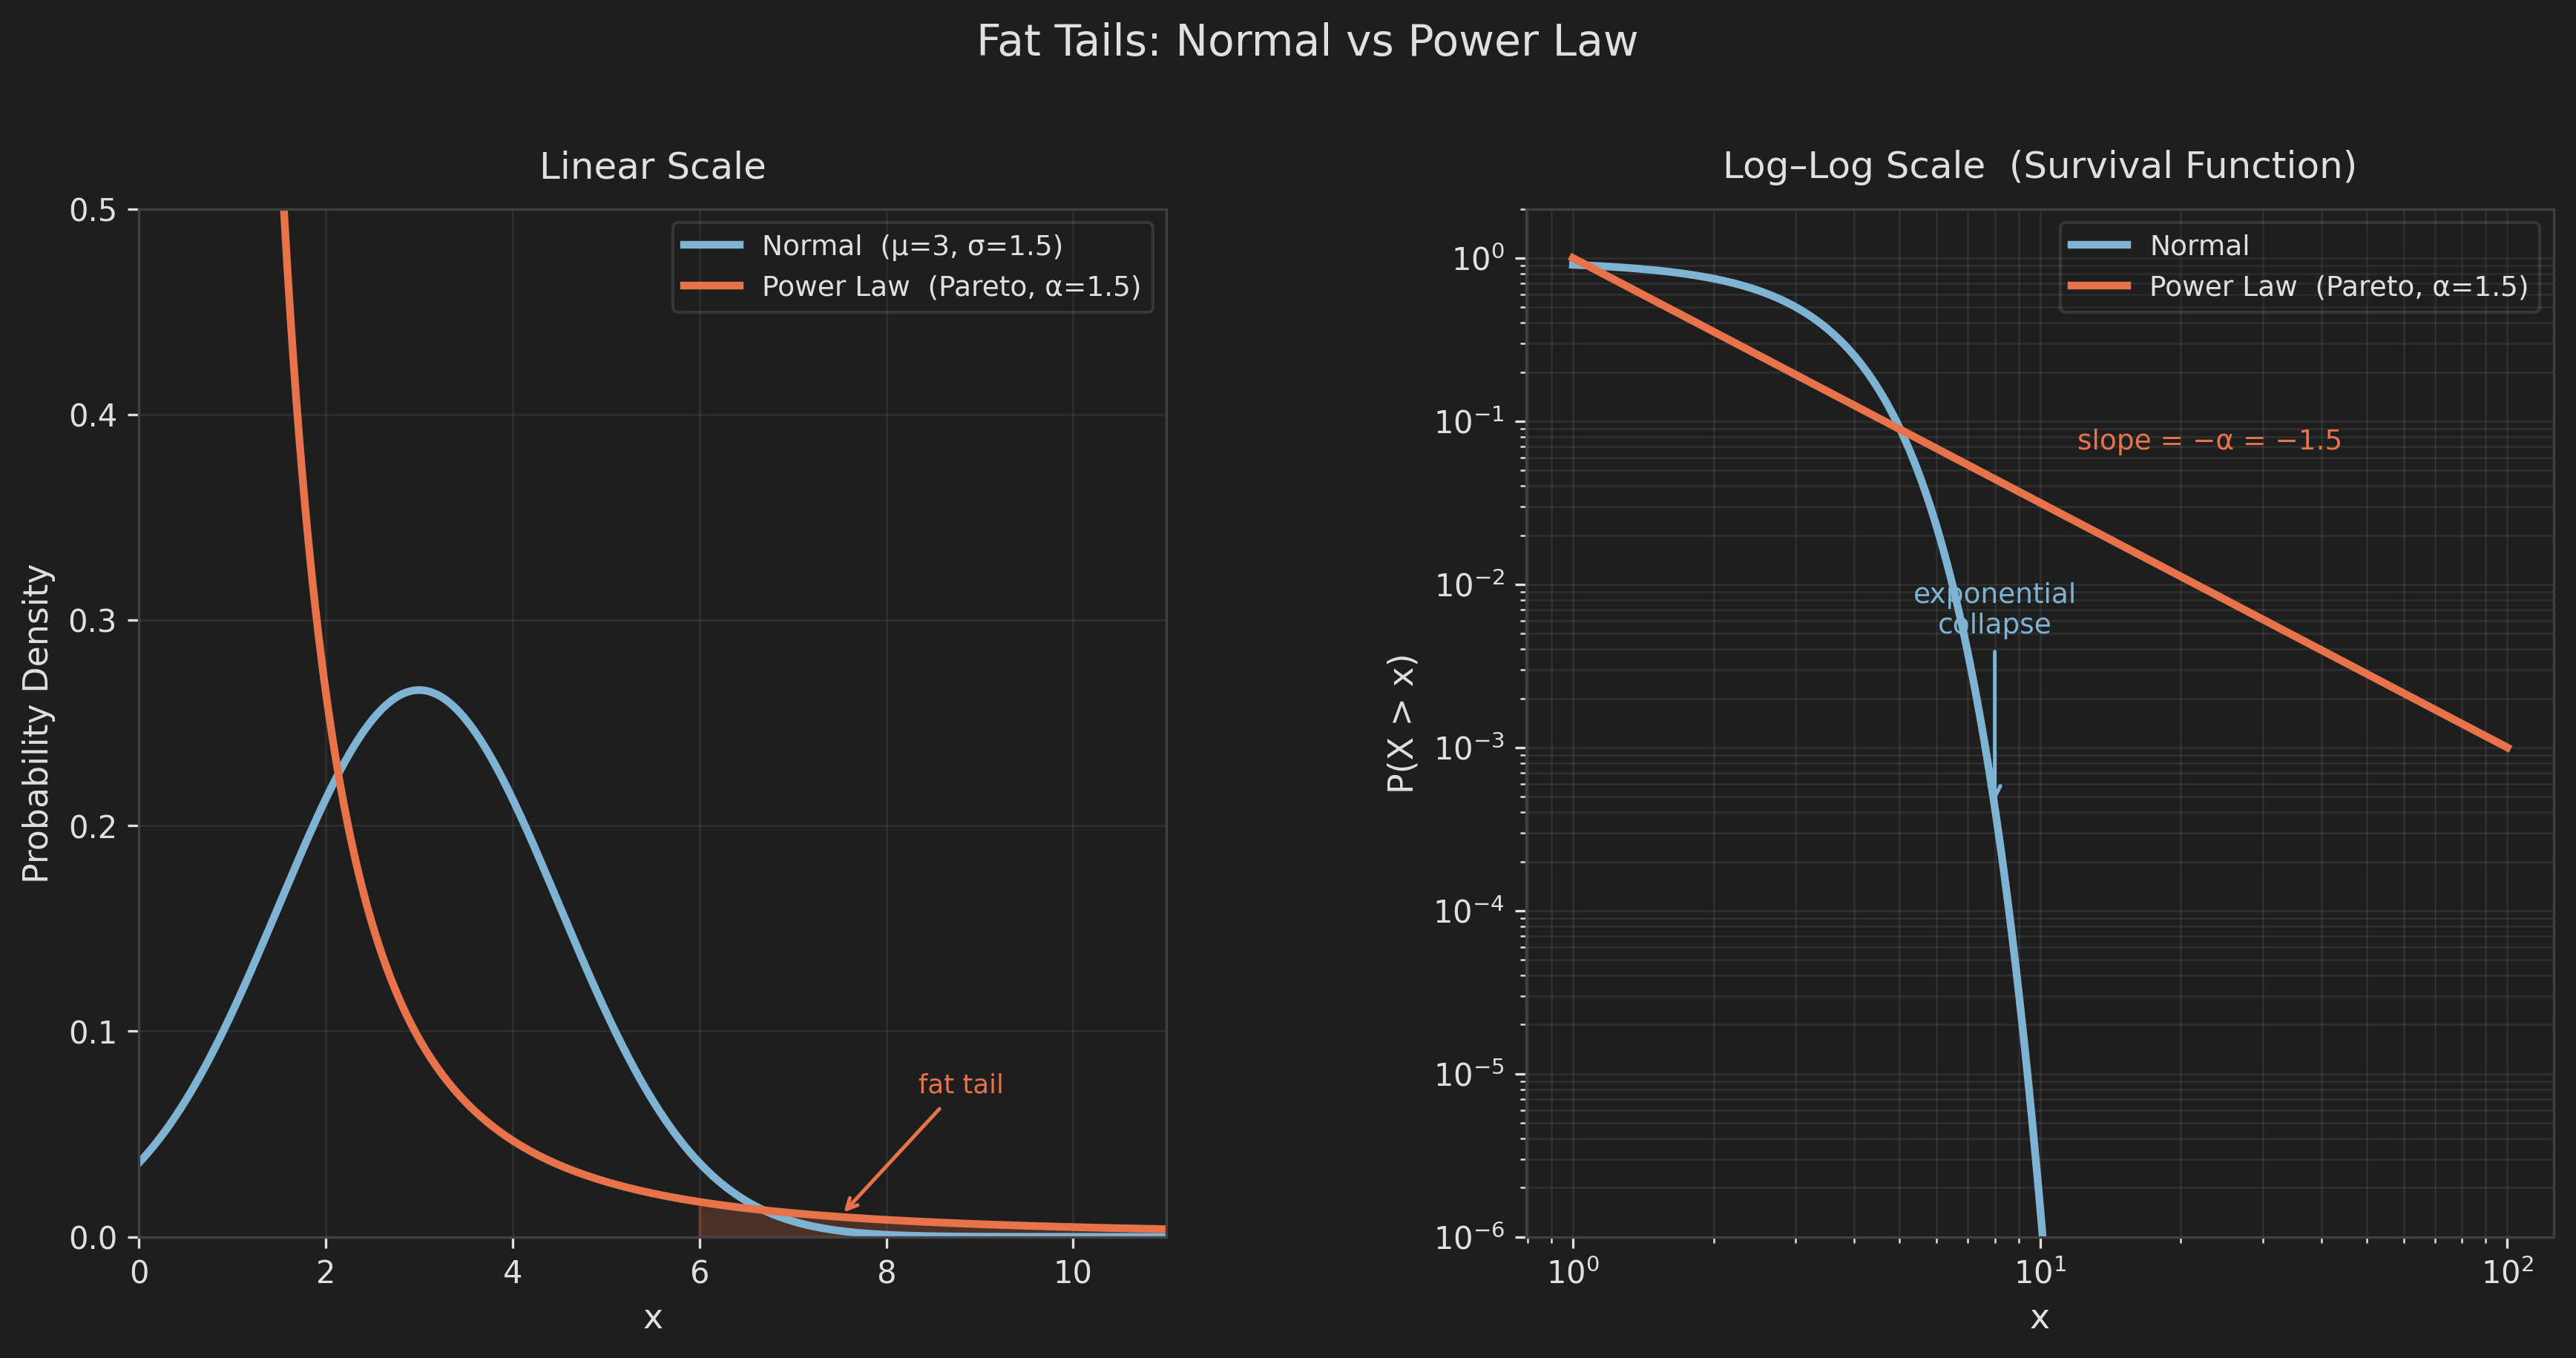
Normal versus power law on the same axes. On the left, the fat tail is nearly invisible. On the right, it tells the whole story.
On the left panel, the differences in the tail seem minuscule. Both distributions appear to flatten close to zero. Nothing you would lose sleep over. On the right, however, the log-log plots show a massive difference in large events. The blue curve plunges while the orange line remains flat.
These "fat tails" are the defining characteristic of Extremistan. They give a significantly larger chance of extreme events occurring, and they're incredibly easy to miss unless you notice them.
Again, this is intuitive for Mediocrestan. It's almost impossible to find human beings taller than 8–9 feet.
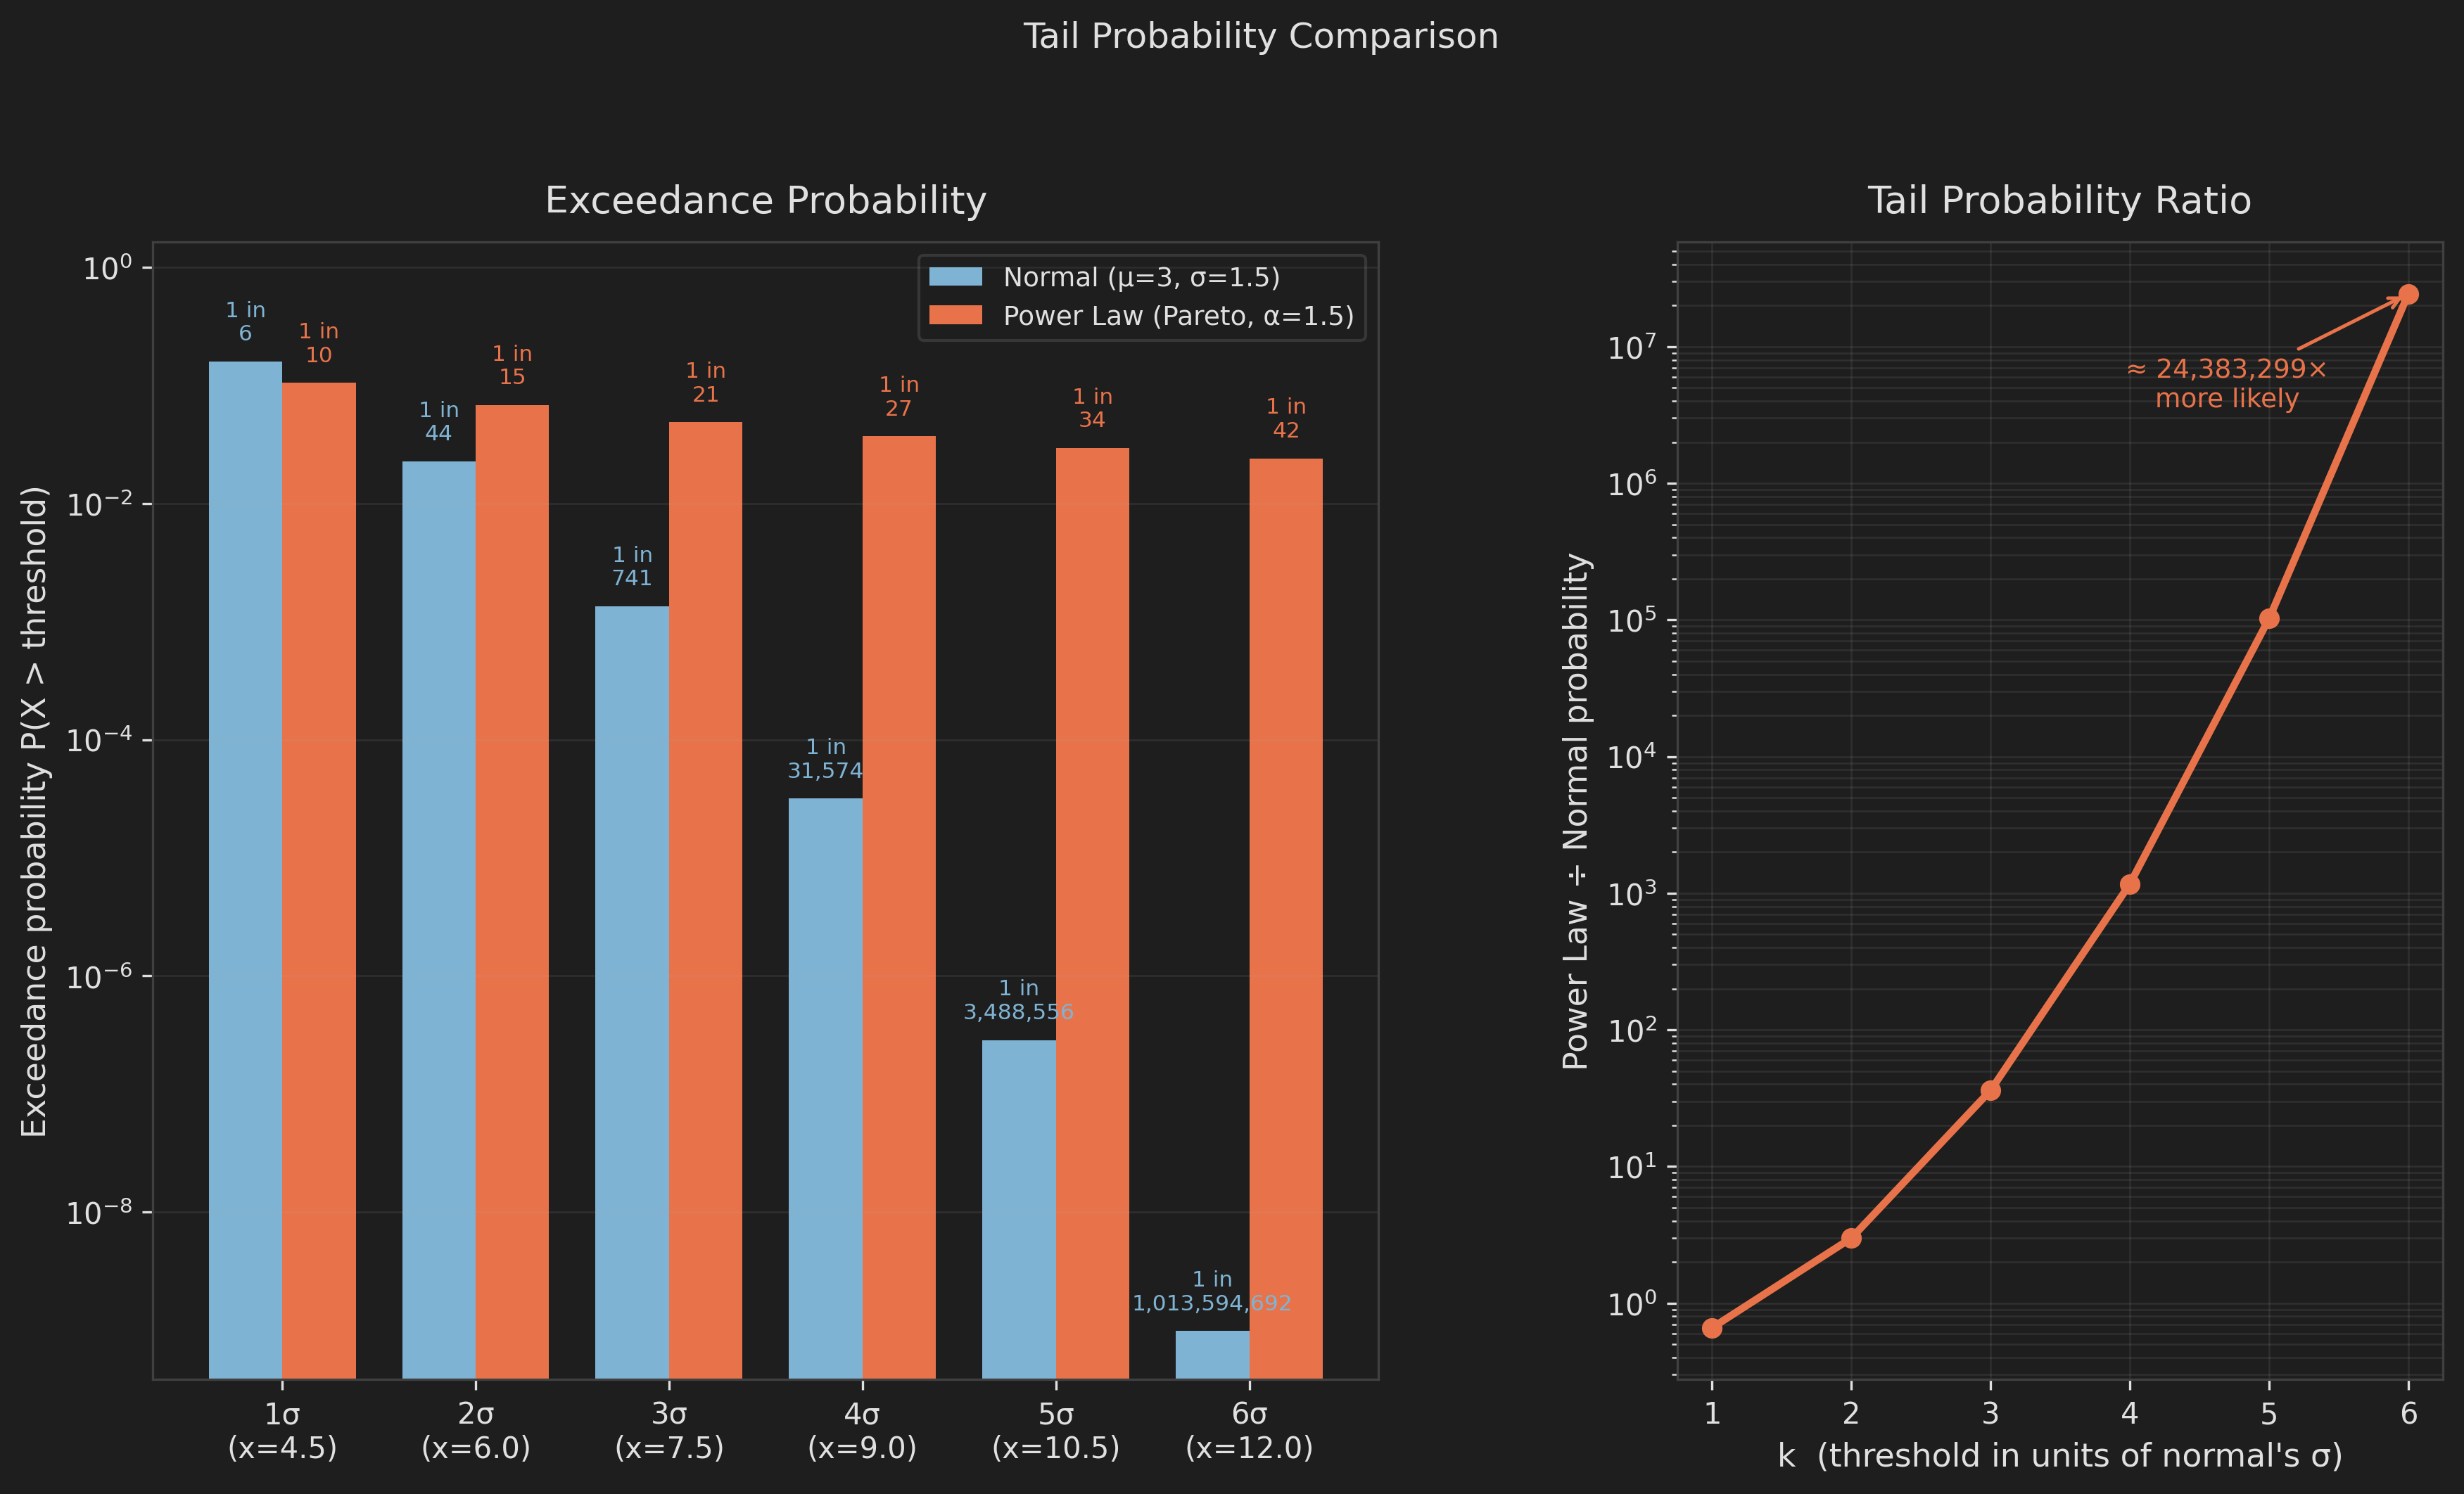
At one standard deviation, the two distributions roughly agree. By six standard deviations (far out at the tail), the power law says the event is about 24 million times more likely than the normal distribution claims.
The fund from Part 1 of our series, Long-Term Capital Management, thought they were dealing with the blue line. Their historical data fit the blue curve (which is poor evidence, as we'll discuss later), and they assumed that was the world they lived in. Their models said a simultaneous collapse across every market was effectively impossible, a value out past the cliff on the blue curve, so they borrowed huge amounts of money to place larger bets on the market. Then Extremistan handed them what they thought was a "rare" event only four years later.
The turkey made the same wager with its life, thinking a thousand peaceful mornings were sufficient proof to assume the blue line was reality.
So we've answered the question Part 1 left open. Extremistan doesn't follow the bell curve; it follows a power law. And fat tails are one of the defining features of power laws: they can sneakily deliver extreme events far more often than we'd expect.
But why do power laws appear in the first place?
The System Dynamics of Extreme Behavior
Despite the difficulty we have finding power laws with existing statistical methods, we can infer them based on the underlying behavior of a system. A power law has no natural scale, no typical size for things to cluster around. So the real question becomes: what kind of system erases its own sense of scale? While not an exact science, some systems lend themselves to this kind of behavior far more than others.
Reinforcing Feedback
Reinforcing feedback loops play a key role in creating extreme behavior. When two or more factors reinforce each other, it can cause behavior that increases exponentially. This is the opposite of the additive, independent effects that define Mediocrestan.
Cities are an excellent example of this. Generally speaking, as a population grows, businesses shift to population centers. These cities are likely to have a larger talent pool and more potential customers. As businesses flock to a city, people will often seek to live there. Businesses provide employment, services and entertainment. The tax revenue provides nicer parks, a revamped city center, and other amenities. This population growth attracts more business.
You can see how this reinforcing behavior could play out over time. If you look at the distribution of city size using their layouts (specifically street nodes and ends, not their administrative boundaries), they map closely to a power law distribution.
Multiplicative Growth
Multiplicative growth can cause extreme behavior as well. Wealth distributions (which also follow a power law) are an excellent example. Having a certain amount of money allows you to invest. The interest you earn is multiplicative (investment × interest = return), and your returns can be reinvested. Instead of making a flat amount each year (year 1 + year 2 + … etc.), you multiply your earnings. Wealth begets wealth.
Contrast this with growth in Mediocrestan, which is additive. If you look at the weight of individuals, being a certain weight doesn't cause you to add or lose weight by definition. Each day you add or lose a bit of weight, based on your diet. Over time this may add up to being obese, or skinny, but the distribution will follow our normal bell curve.
Multiplicative effects in the underlying system increase extreme behavior.
Self-Organized Criticality and Cascades
Systems that allow the propagation of effects also exhibit extreme behavior. The Earth's crust shows this behavior when earthquakes occur. Tectonic stress builds slowly along a fault line until it exceeds a threshold and releases in a rupture that can cascade to neighboring segments. The resulting distribution of earthquake magnitudes follows the Gutenberg–Richter law, a power law that has held for over a century of seismic data.
Power grids are another great example. Small failures in an electrical grid can cascade as load redistributes onto remaining lines, sometimes tripping a chain reaction across an entire regional grid. Historical blackout sizes (measured in megawatts lost) follow a power-law distribution, a finding used directly in grid resilience planning.
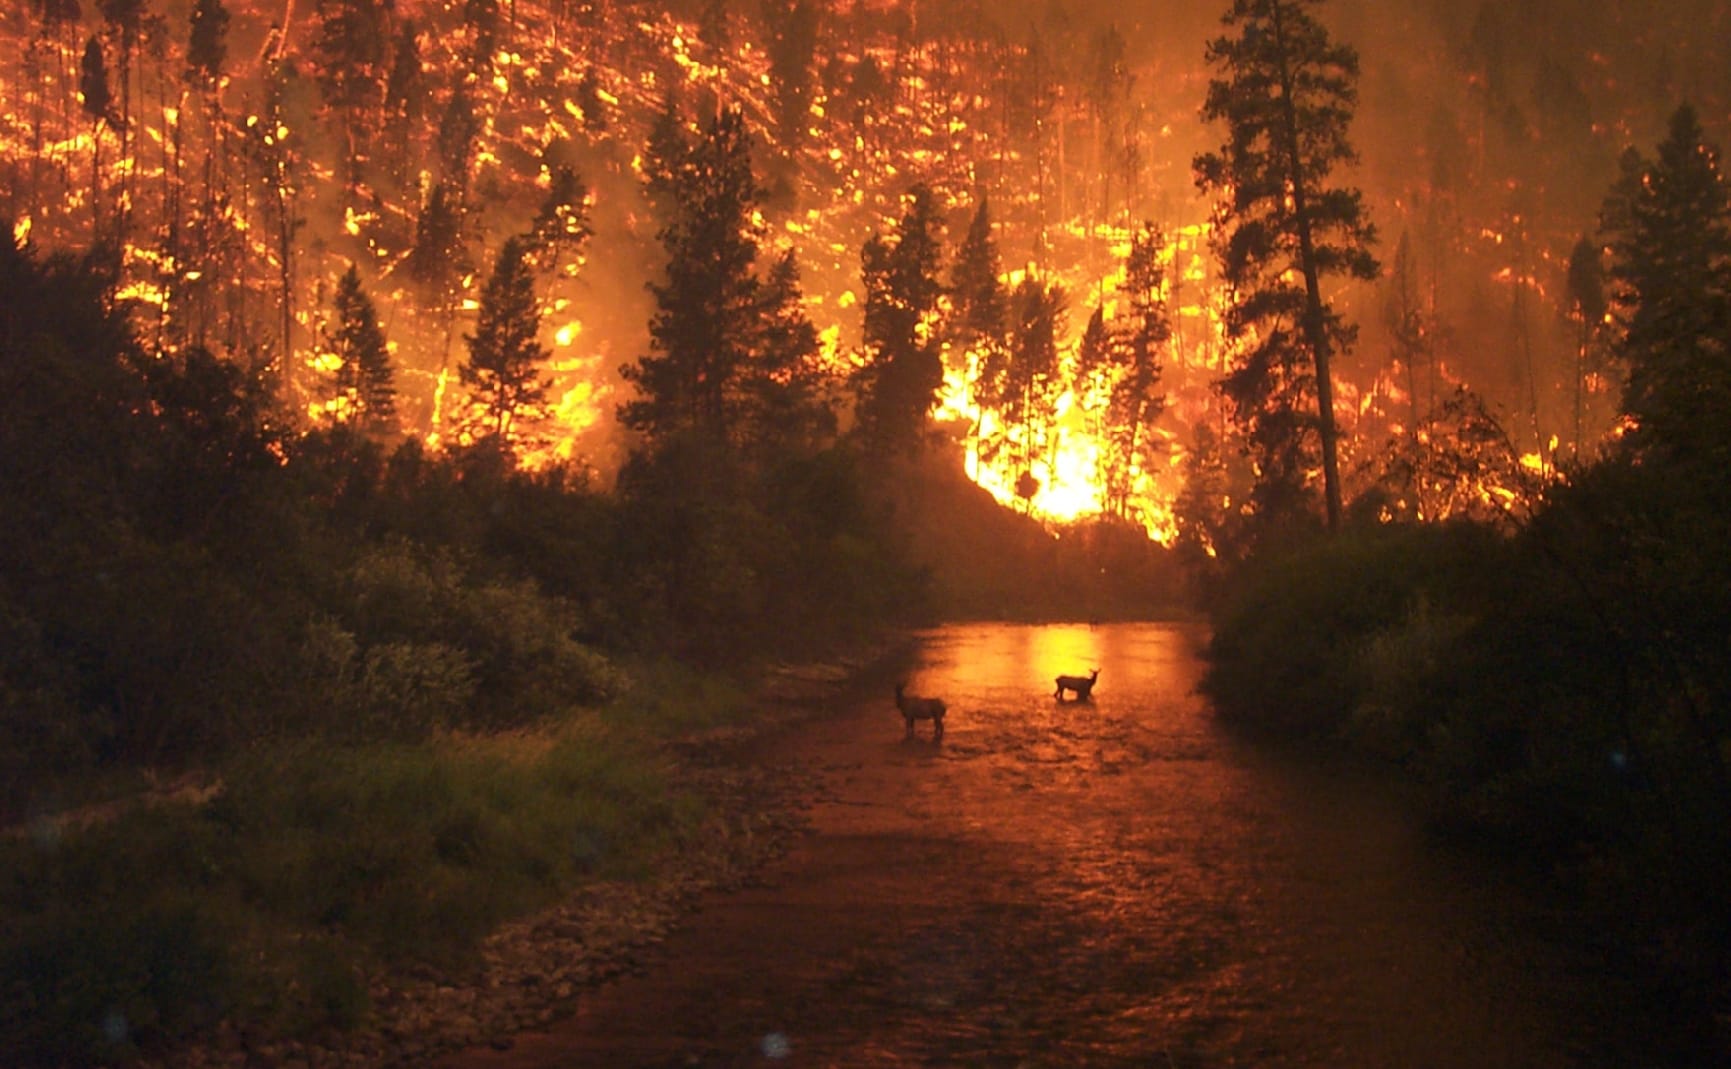
"Elk Bath," John McColgan, 2000 Bitterroot Fire. A forest primed by decades of fuel buildup needs only a spark to cross a critical threshold. Once it does, the blaze doesn't stay proportional to its cause, it cascades, consuming everything within reach at every scale.
What both examples share is a system poised right at the edge of a threshold, a state physicists call criticality. Push a system to that edge and it loses any characteristic size for its own events. Zoom into the data and small ruptures and large ones follow the exact same statistical pattern; there's no scale at which the behavior looks any different. This loss of scale is experienced as a massive release of energy, like a forest being engulfed in flames or a record breaking siesmic event.
Fragility
These three mechanisms, reinforcing feedback, multiplicative growth, and cascades, generate the extreme behavior. The impact of that behavior depends on a system's thresholds, and whether they are static or dynamic.
Take the Fukushima Daiichi Plant, which we covered in Part 1. The plant was designed to withstand the largest wave in the historical record, a fixed threshold. If a system is calibrated to withstand a specific threshold, it's only a matter of time before the factors above produce something that exceeds it. These mechanisms create extreme events, but a system's design and tolerance to stress determine the damage done.
A system that exhibits the three multiplicative dynamics above, and has a fixed tolerance to stress, is poised for extreme events. It doesn't matter how these dynamics present, recognizing them doesn't automatically protect you. Extreme events don't occur on a regular, predictable schedule, so you can recognize the underlying dynamics perfectly well and still have no way of knowing when they'll produce something extreme.
Epistemic Errors
We've established what power laws look like and the mechanisms that produce them. Knowing this should make us better equipped to spot them in the wild. Often, it doesn't, not nearly as much as it should. Extreme systems aren't just statistically hard to pin down, they're hard for us to reason about.
Non-Linearity
Human intuition evolved in Mediocrestan. For most of our history, the inputs that mattered, food, weather, the size of a rival tribe, were roughly additive and bounded. Twice the effort got you roughly twice the result. This shaped how we reason. We expect consequences to be proportional to their causes (linearity).
Extremistan is not linear. A reinforcing loop doesn't add, it compounds. A system sitting at a critical threshold doesn't fail a little at a time, it fails at every scale, all at once (non-linearity). None of this maps onto the linear intuition we posses. We don't just lack the data to see these systems coming, we lack the native instinct to reason about them even when the data is presented us.
The Problem of Induction
This cognitive mismatch collides with an older philosophical one. David Hume pointed out centuries ago that no amount of past observations can perfectly inform the future. The sun rising every day of your life is not proof it will rise tomorrow. It might make you more sure of it, but you can never be absolutely certain.
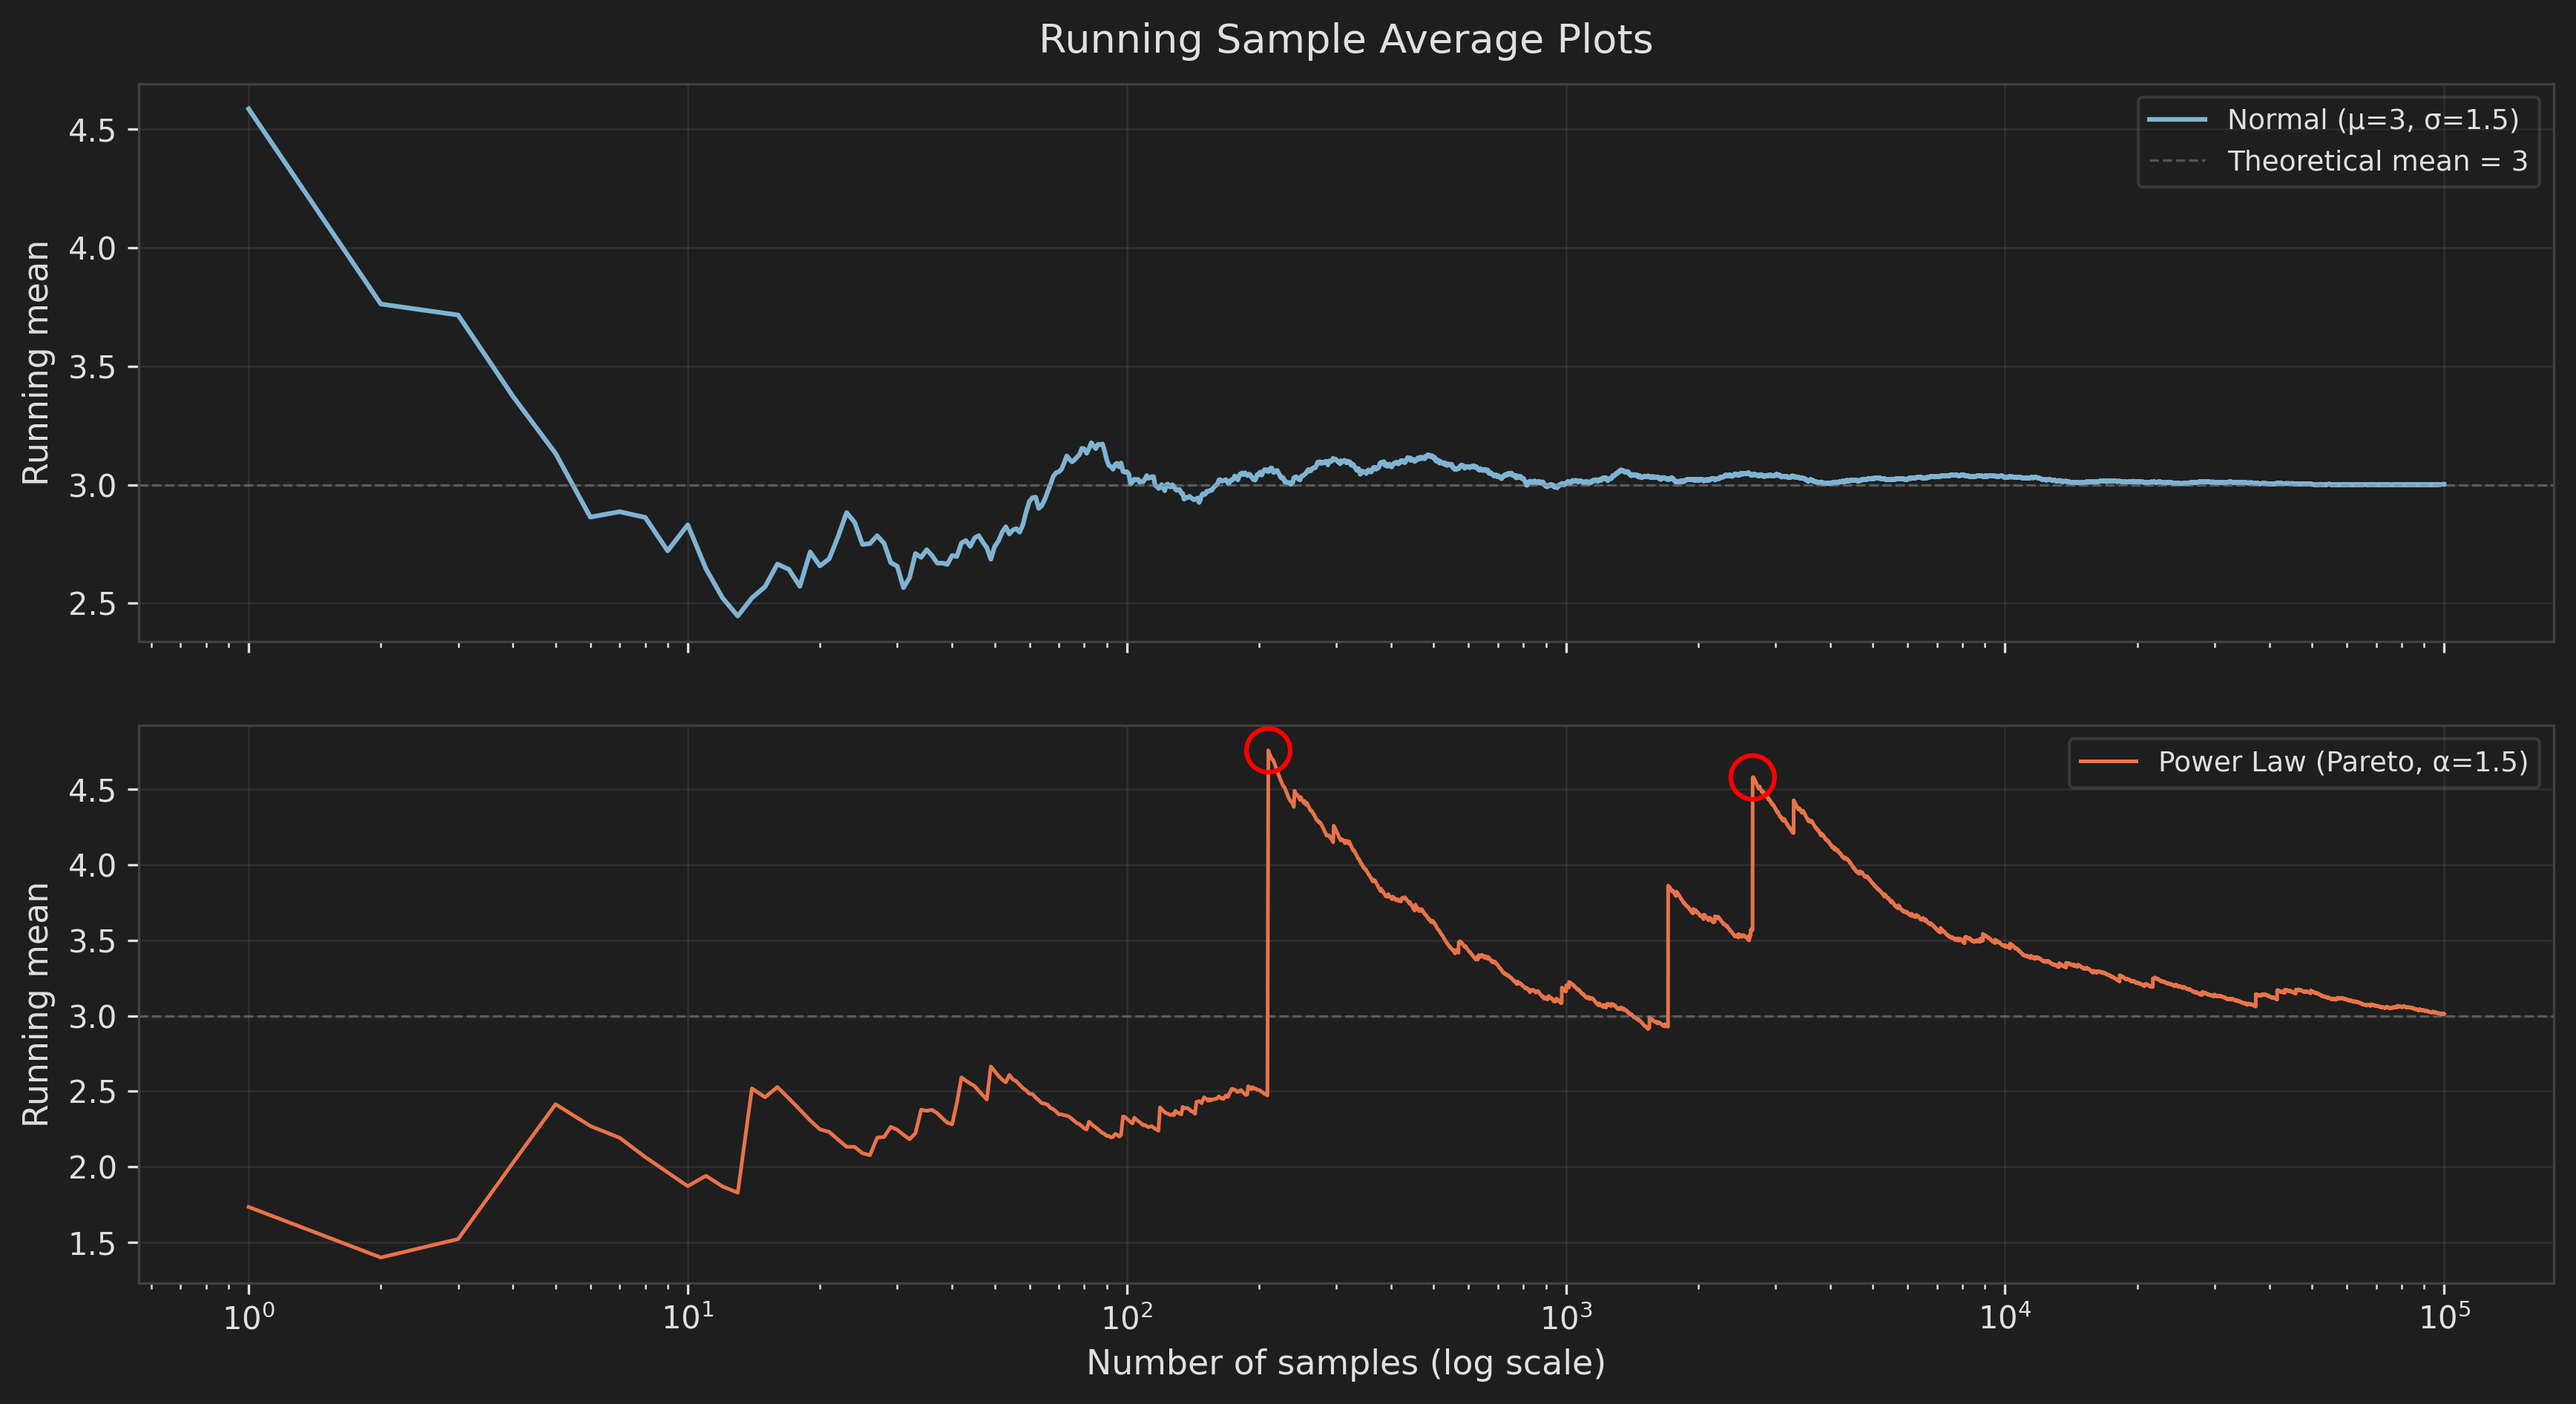
As you sample from a normal distribution, the mean converges (blue line). As you sample from a power law distribution, the mean jumps from extreme events (orange line). It will appear to converge like a normal distribution, and then spike. Forever.
In Mediocrestan, this gap between induction and proof rarely matters. The errors are small and bounded, so betting on the past is a perfectly reasonable way to live. In Extremistan, the same logical gap can produce catastrophic error, because the thing you failed to induct is potentially the event that kills you. This is the mistake the proverbial turkey from Part 1 made.
Absence of Evidence
In Extremistan, every day without a catastrophe fails to prove you're safe and it can make you feel safer than you actually are.
Consider the turkey again. Day 1, it has one data point suggesting the farmer is benevolent. Day 500, it has 500 data points. Its confidence has grown enormously. Its actual safety has not changed at all, and arguably it's gotten worse. On day 500 our turkey is larger in preparation for the Thanksgiving feast. On the final day of it's life, the turkey has the most confidence that it is safe.
LTCM ran the same experiment with more sophisticated instruments. Every day's worth of data in backtesting and every profitable quarter added to their confidence in the investment strategy. By the time Russia defaulted, they had years of consistent returns, all of it pointing in the wrong direction.
In Extremistan, absence of evidence isn't neutral. It's actively misleading, and it gets worse the longer it lasts. It's akin to inhaling a poisonous gas that lulls you to sleep before killing you.
Positioning, Not Prediction
In Part 1 we split the world into two:
- Mediocrestan, where effects are additive, independent, and no single observation can hijack the whole.
- Extremistan, where effects are multiplicative, interdependent, and one observation can dominate everything.
We used the "Turkey Problem" as an analogy for mistaking Mediocrestan for Extremistan. Our proverbial turkey treats each peaceful day as evidence that it's safe, right up until the morning it's killed for Thanksgiving, the extreme event it never saw coming.
In this piece, we dove into the mathematics, system dynamics, and epistemic errors underlying Extremistan. This world is best described by power laws, and it's produced by reinforcing loops, multiplicative growth, and cascades poised to generate extreme behavior. We also saw how our own biases and evolutionary wiring make this terrain especially difficult to navigate. Our intuitions weren't built for this world.
Extremistan is more dangerous than our instinct suggests, and most of our systems simply weren't designed to withstand it. But a simple shift in perspective changes things. Rather than trying to predict the future with precision, we can focus on positioning ourselves so that Extremistan's unpredictability doesn't hurt us, and can even work in our favor. That's where we're headed in Part 3.
Learn More
- The Incerto Series - Nassim Taleb
- Statistical Consequences of Fat Tails - Nassim Taleb
- The Misbehavior of Markets - Benoit Mandelbrot